Why your eCommerce site passes Lighthouse but real shoppers still experience a slow store
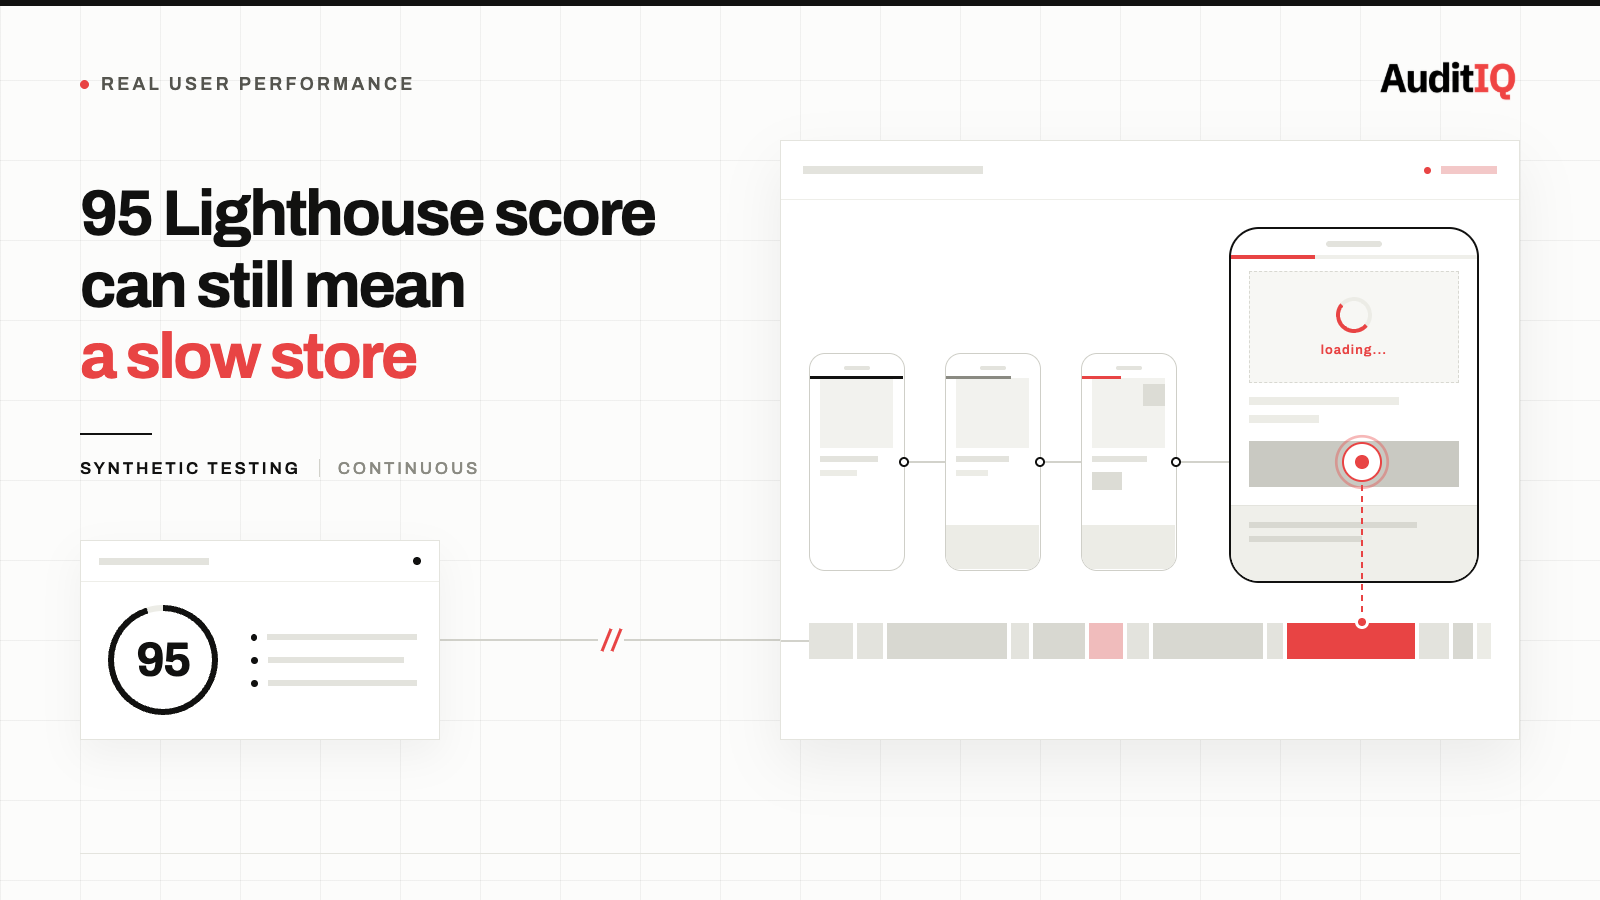
An eCommerce site can pass Lighthouse and still feel slow to real shoppers because Lighthouse measures a single, anonymous page load under controlled lab conditions, while real customers browse multi-page journeys on mid-range phones over variable networks, carrying third-party scripts, personalisation, and accumulated page weight the lab test never sees. Closing the gap means comparing lab scores against real-user field data in PageSpeed Insights and Search Console, then fixing whichever of third-party scripts, personalisation logic, or multi-page accumulation is actually responsible.
A good Lighthouse score does not mean your customers are having a fast experience. Lab tests like Lighthouse measure a single page load in isolation under controlled conditions, while real shoppers navigate multi-page journeys on mid-range phones over variable networks where third-party scripts, personalisation logic, and uncached content create a shopping experience that is measurably slower than your score suggests. The gap between lab and field performance is where eCommerce conversion silently erodes.
If you have invested in performance optimisation but conversion rates have not improved, the problem is likely that you have been optimising for a test rather than for the shopping journey your customers actually take.
Lab vs Field: The gap that's costing you conversions
Lighthouse runs a single page load on a simulated device with a throttled network connection, no cookies, no logged-in state, no personalisation, and no previously loaded third-party scripts. It scores the result against a set of metrics, and eCommerce teams celebrate when the number is green. This split between what Lighthouse measures and what Google actually evaluates for ranking is what web.dev calls the lab and field data difference.
But real shoppers do not experience your store the way Lighthouse does. They arrive from a Google Shopping ad or an organic search result, often on a phone that is two to four years old, over a cellular connection that fluctuates in speed. They browse multiple product pages, filter categories, add items to cart, and reach checkout, accumulating third-party script overhead, session data, and DOM complexity with every page.
A strong Lighthouse score does not guarantee good Core Web Vitals for real users. Many sites that look fast in lab tests still fail field metrics. A high lab score tells you a controlled test went well. It does not tell you what most of your actual traffic is experiencing.
This is not an academic distinction. Stores that convert well on mobile are consistently the ones with fast real-user load times, and field Time to Interactive is almost always worse than lab Time to Interactive because real sessions carry everything Lighthouse deliberately strips out: cookies, ads, personalisation, and every script that loaded on the page before it.
What Lighthouse never sees: The real shopping journey
Third-party scripts load differently in the wild
In a Lighthouse test, third-party scripts often do not fully initialise because there is no cookie consent interaction, no returning-visitor session, and no ad auction. In a real session, the consent banner fires, the shopper accepts, and then analytics, chat widgets, review platforms, A/B testing tools, and remarketing pixels all initialise simultaneously.
Third-party scripts compete for the same main thread the browser needs to respond to user interactions. According to the 2025 Web Almanac, 92% of pages load at least one third-party resource, and scripts make up nearly a quarter of all third-party requests, making them the single largest source of uncontrolled variability in any field performance investigation.
Personalisation and logged-in state add latency
Lighthouse tests as an anonymous first-time visitor. Your returning customers trigger personalisation engines, customer segment logic, recently-viewed carousels, loyalty tier pricing, and geo-targeted content, all of which add server-side processing time and client-side rendering work that the lab test never encounters.
Multi-page journeys compound the problem
Lighthouse tests one page. A shopping session typically spans five to twelve pages: landing page, category browse, product detail, potentially related products, cart, and checkout. Memory usage grows, JavaScript heap fragmentation increases, and any scripts that do not clean up after themselves accumulate across navigations. By the time the customer reaches checkout, the browser is carrying the weight of every page they have visited.
Device and network variability
Lighthouse throttles to a simulated mid-tier mobile device. But the actual population of devices visiting your store includes everything from budget Android phones with 2GB of RAM to the latest flagship. The bottom 25% of your real visitors, the ones most likely to bounce, are using devices that are significantly slower than Lighthouse's simulation.
Why INP shows the biggest lab-field gap
Lighthouse cannot measure Interaction to Next Paint (INP) directly in lab mode because there is no user to interact with the page; it uses Total Blocking Time as a proxy instead. INP, the Core Web Vital that field data actually reports, measures responsiveness across every real tap and click during a session, which is exactly where third-party scripts and main-thread congestion do their damage. That mismatch between a lab proxy metric and the real field metric is why INP typically shows the largest divergence of any Core Web Vital between what Lighthouse reports and what your customers experience.
5 steps to find the gap on your own store
Step 1: Compare lab and field scores in PageSpeed Insights
Open your key product, category, and checkout pages in PageSpeed Insights. Compare the lab scores at the top with the field data from the Chrome User Experience Report (CrUX) at the bottom. If your field LCP, INP, or CLS is worse than your lab scores, you have a lab-field gap. If you run on Shopify, the platform's own lab vs field documentation walks through the same distinction in a theme-specific context.
Step 2: Check Core Web Vitals in Search Console
Navigate to the Core Web Vitals report in Google Search Console. If pages are marked as “Poor” or “Needs Improvement” for field metrics despite having good Lighthouse scores, the gap is confirmed and affecting your search rankings. Field data, not your lab score, is what Google actually uses when it evaluates Core Web Vitals for ranking purposes.
Step 3: Segment by device and connection type
If you have Google Analytics 4 configured, look at conversion rate segmented by device category and browser. A significant mobile-desktop conversion gap, beyond what is explained by user intent differences, is often a performance gap in disguise. Similarly, compare conversion rates for sessions originating from different geographic regions or network types.
Step 4: Audit third-party script impact
Use your browser's DevTools Performance panel on a real mobile device (not the simulator) to record a multi-page shopping journey. Note which third-party scripts are executing during interactions and how much main thread time they consume. The scripts that appear idle in a Lighthouse test often dominate the main thread in a real session.
Step 5: Measure the full journey, not just individual pages
The most important performance measurement is the one Lighthouse cannot do: timing the full journey from landing page to checkout completion. Each step transition, each interaction response, each layout shift during navigation, these compound into the real experience that determines whether the customer completes their purchase.
What's actually slowing you down
- Third-party script overhead after consent, analytics, chat, A/B testing, reviews, and remarketing pixels initialising simultaneously after cookie consent, consuming main thread time and delaying interaction responsiveness
- Personalisation and customer segment processing, server-side and client-side personalisation logic adding latency for returning customers and logged-in users that first-visit lab tests never encounter
- Uncached content on subsequent page loads, product images, variant data, and dynamically loaded content that is served from CDN cache on the first page but requires fresh server requests on subsequent pages
- JavaScript heap growth across navigation, memory leaks and unreleased event listeners from scripts that do not clean up when the page transitions, degrading performance progressively through the session
- Real device CPU constraints, JavaScript execution on budget and mid-range phones taking two to five times longer than the simulated device Lighthouse uses
Verification: How to confirm you have fixed the right thing
After addressing the identified bottlenecks:
- Re-run PageSpeed Insights and compare the updated lab scores against the field data. The gap should narrow.
- Monitor CrUX data over the next 28 days, the standard CrUX collection period. If field metrics improve, the fix is working in production.
- Compare conversion rates for the same device segment before and after the change. Performance improvements should correlate with measurable conversion gains.
- Check INP specifically, Interaction to Next Paint is the Core Web Vital most affected by third-party scripts and the one most likely to diverge between lab and field.
Continuous monitoring: The only way to keep the gap closed
The lab-field gap is not a one-time problem to fix. Every new app installation, tracking pixel, consent banner update, or theme change can reopen the gap. The only sustainable approach is continuous real-user monitoring (RUM) that measures performance as real shoppers experience it, across the full journey, on real devices, under real network conditions.
Synthetic tests remain valuable for catching regressions during development. But they should never be the sole source of truth for the performance your customers experience. Use lab tests to diagnose. Use field data to decide.
This is exactly the split AuditIQ is built around, and it covers both sides of it:
- Real User Monitoring: tracks Lighthouse performance scores alongside real Google CrUX field data daily, for up to 10 key pages including product, category, and checkout, with cross-device breakdowns and degradation alerts so a widening lab-field gap surfaces as soon as a meaningful trend emerges, not weeks later when traffic has already dropped.
- Script Inventory: maintains a running ledger of every script executing on your store, so when a new chat widget, A/B testing tool, or remarketing pixel gets added and starts competing for main thread time after consent, you can see exactly what changed instead of guessing which of a dozen third-party scripts is responsible for a slower INP.
Beyond performance, AuditIQ is a 360° eCommerce monitoring platform purpose-built for Magento, Adobe Commerce, and Shopify stores. It continuously monitors every critical layer of a store, performance, infrastructure, SEO, security, user experience, configuration, and code quality, from a single, unified dashboard, so you can find and fix the problems that are costing you conversions before they accumulate into measurable revenue loss.
Start monitoring your real-user performance for free to see the gap between your Lighthouse score and what shoppers actually experience.
Others also read
- Ecommerce site is slow on mobile but fast on desktop: What it's costing you in conversions?
- The 2026 Core Web Vitals reality check: Why INP is the metric eCommerce teams can't keep ignoring
- Only 39% of eCommerce sites pass Core Web Vitals: It's costing more than rankings
FAQs
1. Why does my Lighthouse score fluctuate between tests?
Lighthouse scores vary because each test runs on different servers and network conditions. This variability is another reason field data, which aggregates thousands of real sessions, is more reliable for business decisions.
2. Is a Lighthouse score of 90+ meaningless?
No. A high Lighthouse score means you have addressed the most common performance issues in a controlled environment. But it does not guarantee that your real shoppers are having a fast experience, because it cannot account for the variables that only exist in production.
3. Which Core Web Vital is most affected by the lab-field gap?
Interaction to Next Paint (INP) typically shows the largest gap because it measures responsiveness to real user interactions, which are heavily influenced by third-party scripts and main thread congestion, conditions that are far worse in real sessions than in lab tests, where Lighthouse can only approximate responsiveness with Total Blocking Time.
4. How long does it take for CrUX field data to reflect a performance improvement?
CrUX data is collected over a rolling 28-day window. Performance improvements typically appear in field data 2 to 4 weeks after deployment.
5. Should I stop running Lighthouse tests?
No. Continue using Lighthouse for development diagnostics and regression testing. But supplement it with real-user monitoring to understand what your customers actually experience, and make business decisions based on field data rather than lab scores.
About the author
Ginny Ngo writes from AuditIQ's experience monitoring eCommerce performance, SEO, security, and reliability issues across Magento, Shopify, WooCommerce, and Adobe Commerce stores.