Your eCommerce site will load differently on Black Friday than it does today: How peak traffic changes the performance your customers actually experience
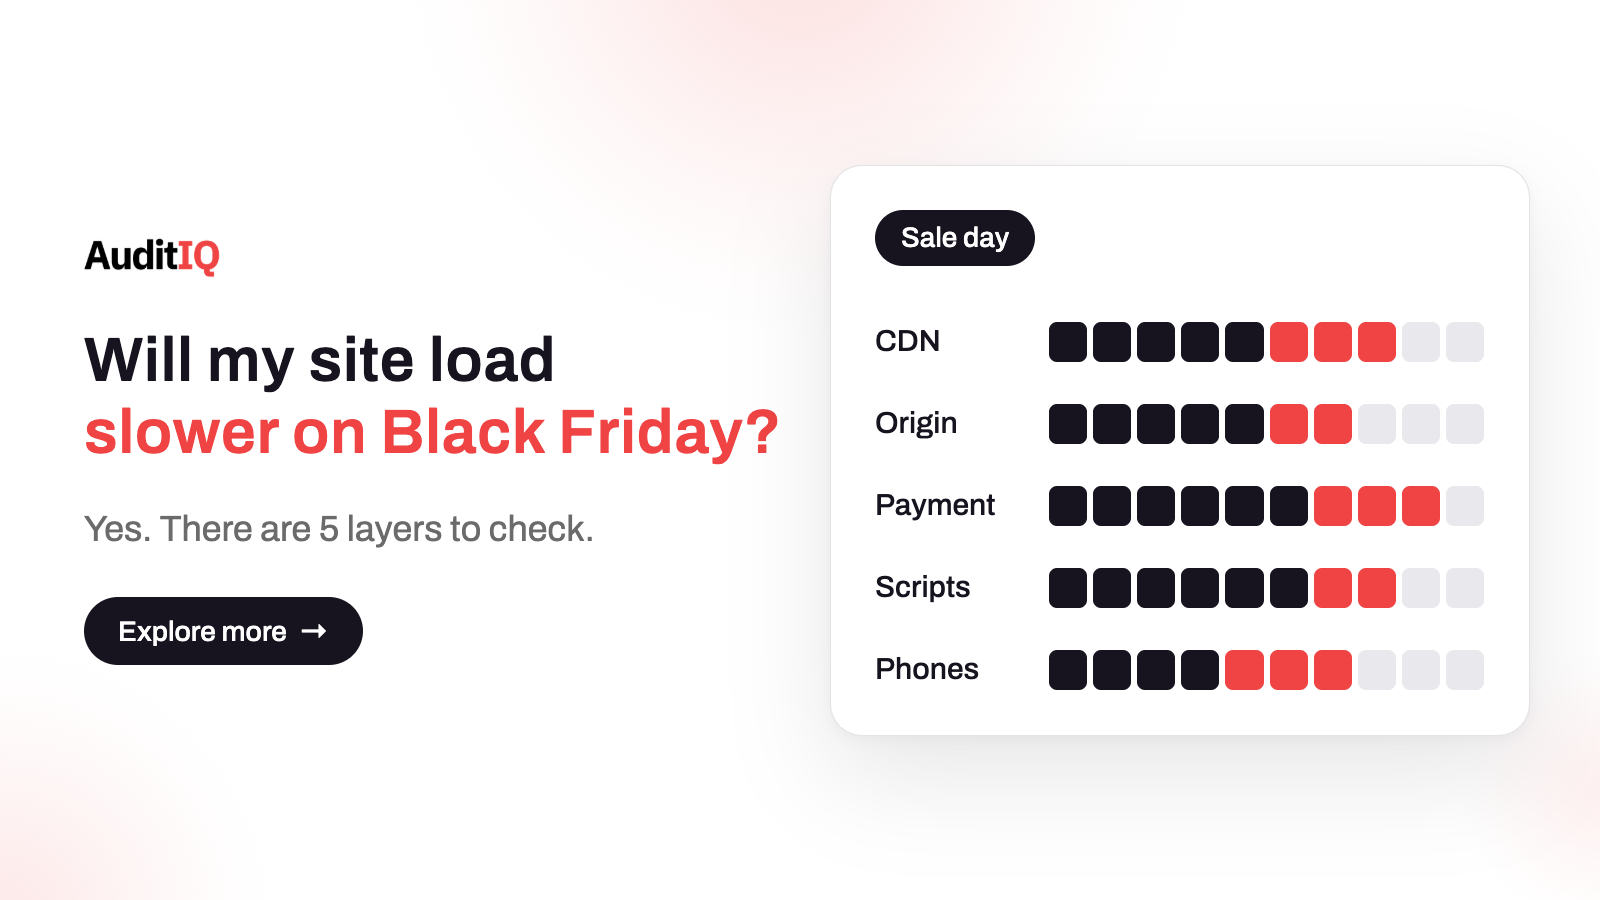
A store that passes every pre-Black Friday test can still slow down on the day, because peak traffic stresses several layers at once: CDN cache misses, origin capacity, payment and fraud calls, third-party scripts, and the phones your customers shop on. Record a baseline now, measure with field data rather than lab tests, defer non-essential scripts, check payment timeouts with your provider, and watch Core Web Vitals and checkout completion against that baseline during the sale.
Picture a store that looked healthy in every October test. The load test passed, the speed score was green, the checklist was complete. Then Black Friday arrives, pages take a beat longer to appear, the checkout hesitates, and nothing in the server dashboard looks alarming. The store is up, but customers are leaving, and the cause is not one slow component. It is several layers slowing together, some of which you do not control.
This guide walks through why a clean test does not guarantee a fast sale day, the five layers that degrade under peak traffic and how to prepare each one, which numbers to record as a baseline, how to set alerts for the day itself, what to do when things slow down, and how to check your monitoring before 27 November.
Why does a store that passed every test still slow down on Black Friday?
Because a test only exercises what you control, under the conditions you chose. Load testing your own infrastructure reveals one layer of the stack. On Black Friday your pages also depend on your CDN, your payment and fraud providers, the card issuers behind 3D Secure, and every third-party script on the page, and those systems face their own peak at the same time as yours. None of them is under peak load during your test.
Lab tests have a second limit that Google’s own guidance spells out: lab measurement is the best way to catch regressions before release, but it is not a substitute for field measurement, because performance varies with the visitor’s device, network conditions, and whatever else is running on the device. Black Friday maximises all of those differences. The sections below take the layers one at a time so you can prepare each one and watch it on the day.
The five layers that slow down on sale day
| Layer | What degrades | Prepare | Watch |
|---|---|---|---|
| CDN | Cache misses and edge response | Pre-warm key pages and review cache headers | Cache hit ratio against your baseline |
| Origin server | Database connections, workers, memory | Defer background jobs and tune the slowest queries | Server response time and error rate |
| Payment and fraud | Gateway, fraud-check, and 3D Secure calls | Review timeouts and retries with your provider | Payment latency and decline rate |
| Third-party scripts | Script delivery and execution | Remove, defer, or lazy-load non-essential scripts | Script load times and JavaScript errors |
| Browser and device | CPU, memory, network | Test on a mid-range phone with a throttled connection | Core Web Vitals and checkout completion |
1. CDN cache misses
A CDN serves cached pages from edge locations close to the customer. Under normal traffic the same pages are requested repeatedly, so most requests are answered at the edge. On a sale day more visitors arrive for the first time, newly published promotional pages may not yet be cached everywhere, and personalised or region-specific content bypasses the cache entirely. Every miss travels to your origin.
Prepare: pre-warm your promotional landing pages, give key pages sensible cache headers, and cut personalisation from pages that can be served statically. Record your cache hit ratio before the sale so you have your own baseline to compare against.
2. Origin capacity
Your origin has a finite number of database connections, worker processes, and memory. A checkout session holds resources while the customer types payment details, waits for fraud screening, and completes 3D Secure. Product pages that check stock and price compete for the same connection pool, and background work such as inventory sync, feed generation, and order processing keeps running alongside the surge.
Prepare: defer non-essential background jobs during peak hours, review the queries behind your most visited pages, and raise connection limits if your hosting allows it. Check time to first byte on the key pages now, so a slower origin shows up against a known number.
3. Payment, fraud, and 3D Secure calls
Checkout depends on external requests to a payment gateway, a fraud service, and, when required, the card issuer. Those providers carry their own peak load during major sales. Whatever their normal response times are, assume they can be slower on the day, and make sure your checkout can wait long enough for the transaction to finish without a long, frozen page.
Prepare: review your payment timeouts and retry behaviour, ask your provider about expected capacity and any limits that apply to your account, and agree a fallback payment method in advance.
4. Third-party scripts
Analytics, chat, personalisation, and advertising scripts load from servers you do not run. Google’s guidance on loading third-party JavaScript efficiently gives you the order of options: remove a script that adds no clear value, and otherwise load it with the async or defer attribute so it does not block the parser. It also advises establishing early connections only to the origins that matter most, lazy-loading anything non-critical or below the fold, and weighing the trade-offs of self-hosting, where a script can fall out of date.
Prepare: list every script on your product and checkout pages, remove the ones nobody uses, defer the rest unless the page needs them to render, and record when each one normally loads.
5. Your customers’ phones and networks
Many shoppers use mid-range phones on busy mobile networks, and the browser has to download, parse, and run all of your JavaScript. That is far slower on a mid-range device than on the laptop your team tests on, and slower still when other processes compete for the device.
Prepare: test your key journeys on a mid-range phone with the network throttled, and treat that result as closer to reality than any desktop test.
Which numbers should you record before the sale?
Start with Google’s Core Web Vitals thresholds. For a good experience, Largest Contentful Paint should occur within 2.5 seconds, Interaction to Next Paint should be 200 milliseconds or less, and Cumulative Layout Shift should be 0.1 or less, measured at the 75th percentile of page loads and segmented across mobile and desktop. A page passes when all three meet their targets at that percentile.
| What to record | Reference point | Why it matters on the day |
|---|---|---|
| LCP, INP, CLS, mobile and desktop | Google’s thresholds at the 75th percentile | Shows whether most visitors still get a good experience |
| Time to first byte on key pages | Your own normal range | Shows the origin slowing down before pages do |
| Checkout completion rate on mobile | Your own normal range | The business outcome that every layer feeds |
| Payment response time | Your provider’s dashboard and your own normal range | Separates provider slowness from your own |
| Cache hit ratio | Your own normal range | A drop means more traffic is reaching origin |
| Third-party script load times | Your own normal range | Finds the one script that holds the page back |
Google also notes that Chrome’s field data offers a quick assessment but not the detailed per-pageview telemetry needed to diagnose and react quickly to regressions, and recommends that sites set up their own real-user monitoring. Treat that as the standard for the day itself: use field data for the verdict and lab tests for the fix.
How do you set alert thresholds for peak day?
- Use Google’s thresholds as the ceiling for the Core Web Vitals, and alert when the 75th percentile crosses them. Watch the 95th percentile as a separate early signal for your slowest visitors.
- Use your own baseline for everything else. Alert on a sustained rise in server response, payment latency, or script load time, and on a material drop in checkout completion or cache hit ratio, rather than on a universal number.
- Set sale-specific thresholds. Everyday thresholds can fire constantly under peak load and teach people to ignore them. Choose limits that separate expected sale-day behaviour from genuine failure.
- Alert on sustained change, not single spikes, so one slow minute does not wake the whole team.
What do you do when the site starts slowing down during the sale?
- Confirm the scope first: homepage, product pages, cart, checkout, or the whole site, and mobile, desktop, or both.
- Check the origin: server response time, error rate, and database connections. If time to first byte has jumped, start there.
- Check the CDN: compare the cache hit ratio with your baseline. A drop means more requests are reaching the origin.
- Check payment status: your provider’s status page and your own payment latency and decline rate.
- Check scripts: find any third-party script that has slowed down or started throwing errors, and defer or remove it if the page does not need it.
- Reduce load where you can: pause background jobs, and add capacity if your hosting allows it.
- Tell customers if checkout is affected, and offer a fallback payment method.
- Afterwards, compare what happened with your baseline, and write down which layer moved first.
How can you tell your monitoring is ready before 27 November?
Ask four questions of whatever you plan to watch on the day:
- Does it show mobile and desktop separately, at the 75th percentile and beyond?
- Can it separate checkout from product pages?
- Does it track third-party script load times individually?
- How often does each signal update, and does a sustained slowdown reach you in minutes or only the next day?
The last question matters most. Some measurements, such as aggregated field data, refresh daily and are ideal for baselines and trends. Others, such as server health and live traffic, update within minutes and are what you watch during the event. Know which is which before the sale, because a tool that says the site is “up” can sit alongside customers quietly giving up.
What AuditIQ can show you on sale day
AuditIQ gives you two kinds of signal for a day like this: slower-moving baselines that show how your store normally performs, and live signals that show when something shifts.
For your baseline
- Real User Monitoring tracks LCP, CLS, and INP from Google’s real-user field data alongside Lighthouse scores, daily, for up to 10 key pages, with mobile and desktop shown separately and 30-day trend graphs. It is the place to record your starting numbers and to spot a worsening trend.
- Script Inventory keeps a ledger of every JavaScript file on the pages it crawls, with when each was first and last seen, which gives you the list to audit before the sale.
For the live signals
- Server Monitoring collects CPU and disk readings from a server agent every five minutes, so origin strain shows up on a graph.
- User Experience Monitoring shows where customers drop off in checkout, with frustration signals and device, browser, and session context, so a slowdown that costs orders becomes visible.
AuditIQ does not measure your CDN cache hit ratio or your payment provider’s response times, so keep those in your CDN and provider dashboards. Its Core Web Vitals data refreshes daily rather than minute by minute, which is why the live signals above matter on the day.
Sale day is just one occasion for this kind of watching. AuditIQ is a 360° eCommerce monitoring platform purpose-built for Magento, Adobe Commerce, and Shopify stores, covering performance, infrastructure, SEO, security, user experience, configuration, and code quality from a single, unified dashboard, so the same view serves you in every busy week.
Want your baselines in place before the sale? Try AuditIQ free and record how your store performs today.
Others also read
- Why your store still slows down on Black Friday even after passing every load test
- eCommerce holiday traffic readiness: How to find silent storefront failures
- Third-party JavaScript on checkout: Security, performance & compliance risks
Frequently asked questions
1. Can I load-test my payment gateway before Black Friday?
Most providers offer a sandbox or test environment for trying transactions, but it will not reproduce the load every merchant on the platform puts on the provider at once. Use it to test your own flows, then agree timeouts, retries, and a fallback payment method with the provider before the sale.
2. Should I switch off non-essential third-party scripts during the sale?
Where a script adds no clear value, removing it is the first option Google recommends. For the rest, load it with async or defer so it does not block the page, and think twice before removing anything checkout or analytics depends on. Decide the list before the sale, not during it.
3. How will I know if my CDN cache is doing its job?
Record your cache hit ratio in the weeks before the sale and compare the live figure with that baseline. A material drop means more requests are reaching your origin, which is a prompt to check origin load.
4. If I can only watch one number, which should it be?
Checkout completion on mobile, because every layer feeds it. Pair it with the Core Web Vitals thresholds at the 75th percentile (LCP within 2.5 seconds, INP of 200 milliseconds or less, CLS of 0.1 or less) so you can see why it moved.
5. Is a passing Core Web Vitals score enough for Black Friday?
It is a good sign that most visitors get a good experience, but a pass means the 75th percentile meets the targets, not that every visitor does. Keep an eye on slower percentiles, checkout completion, and your payment and script timings as well.
About the author
Ginny Ngo writes from AuditIQ's experience monitoring eCommerce performance, SEO, security, and reliability issues across Magento, Shopify, WooCommerce, and Adobe Commerce stores.