Your A/B testing tool is slowing down your eCommerce store: How to measure the conversion cost of the script that’s supposed to improve it
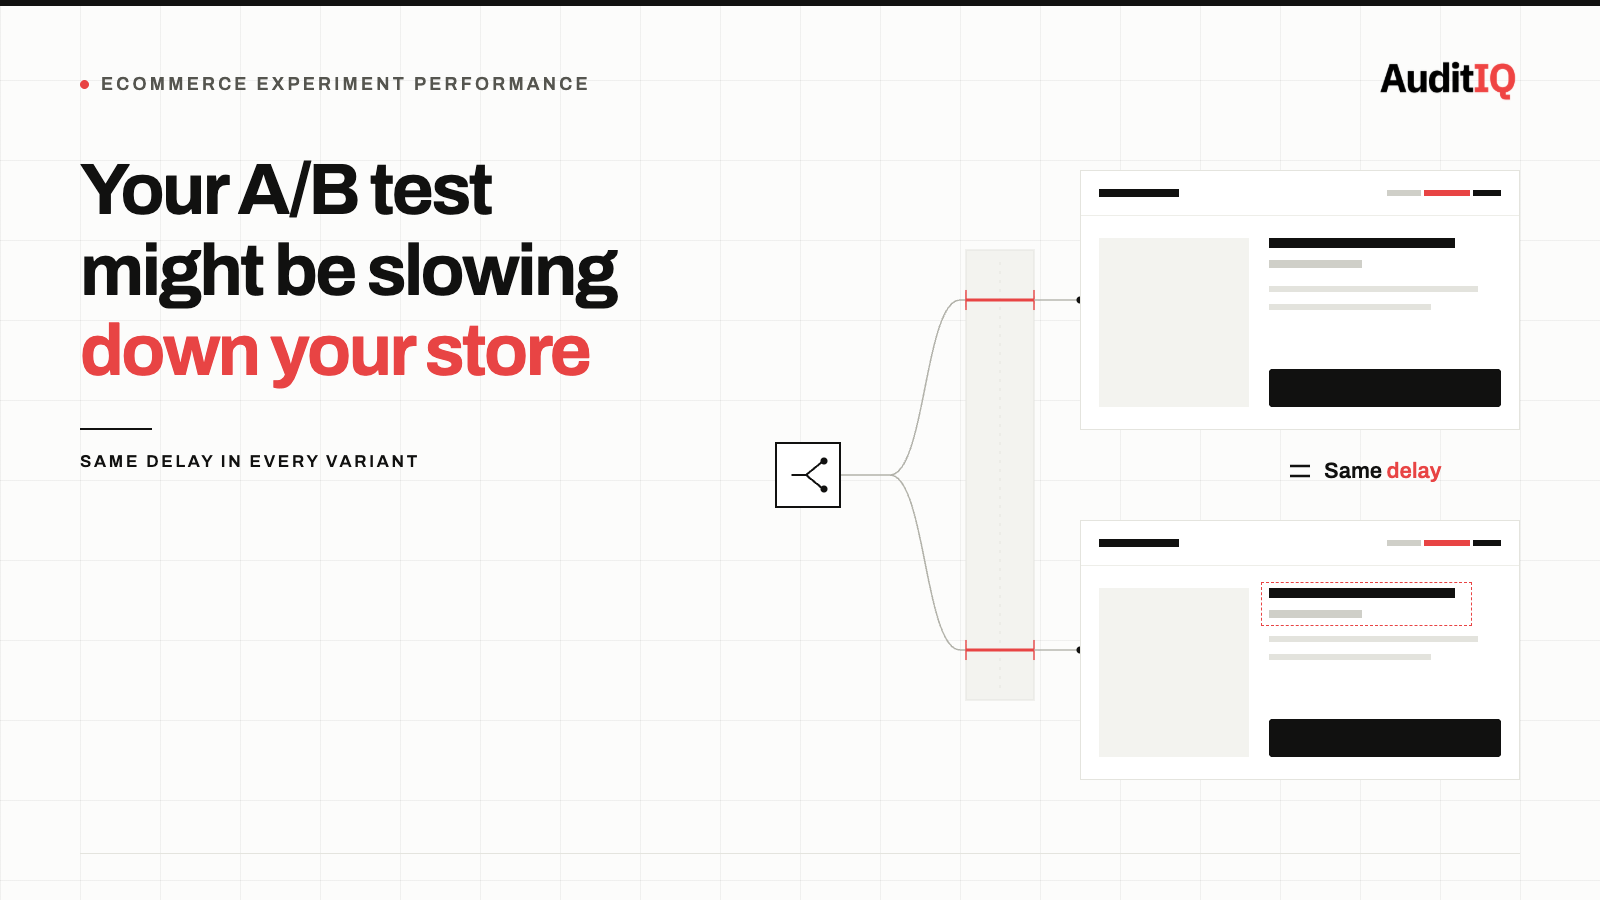
An A/B testing tool can slow your store because its client-side script has to load and evaluate before the page finishes rendering, and its anti-flicker snippet often hides the page until the variant is ready, which pushes Largest Contentful Paint later. Every visitor pays that cost, including the control group. Measure it with a holdout that loads no snippet, then load the tool only on pages with active tests, scope anti-flicker tightly, or move to server-side testing.
A/B testing and CRO tools can add render-blocking JavaScript to every page load and introduce visible page flicker that degrades the shopping experience for every visitor, not just those in the test. The fix is not to stop testing but to measure the tool’s own performance overhead, eliminate the flicker, optimise the script loading strategy, and use real-user monitoring to ensure the testing infrastructure is not costing more conversions than it generates.
The performance paradox: Can your A/B testing tool slow down your store?
You installed an A/B testing tool to improve conversion rates. It runs on every page. It loads a JavaScript snippet before the page renders. It modifies the DOM to show the variant. And while it does this, your customers see a flash of the original content before the variant loads, or they wait, staring at a blank or flickering page, while the script decides which version to show them.
This is the performance paradox of client-side testing: the tool designed to optimise your conversion rate is simultaneously degrading the baseline experience that all your visitors, including those in the control group, receive.
The flicker effect, technically Flash of Original Content, is one of the most common complaints about client-side testing. The original page renders briefly, then the variant snaps into place, creating a visual jolt that can erode trust and perceived quality. Every visitor exposed to flicker has a worse experience than a visitor who sees a clean, immediate page load, and because there is no analytics event for it, it rarely gets flagged.
How do A/B testing tools affect page performance?
Client-side A/B testing tools work by injecting JavaScript that intercepts the page render cycle:
- The snippet loads: A synchronous or asynchronous JavaScript tag fires, typically in the of the page, adding script weight to every page. How much depends on the tool and its configuration.
- The experiment evaluates: The script determines which variant to show based on audience targeting, traffic allocation, and experiment rules. This takes time, and it grows with the complexity of targeting rules and the number of live experiments.
- The DOM modifies: The script applies CSS and HTML changes to transform the control into the variant. This causes the flicker if the original content has already rendered.
- Every page pays the cost: The script loads on every page, even pages with no active experiment, because the tool needs to evaluate whether the visitor qualifies for any running test. In many setups, an anti-flicker snippet can also hide those pages until the tool finishes or times out.
The cumulative impact depends heavily on the tool and how it is installed. A lightweight asynchronous snippet that never hides the page can add very little, while a synchronous snippet or an aggressive anti-flicker setting can noticeably delay the largest visible element on every page. Speed matters for conversion: Portent’s analysis of more than 27,000 landing pages found that goal conversion rates were nearly 40 percent when pages loaded in one second, falling steadily as load times grew. For eCommerce transactions the rates are much lower, around 3 percent at one second and below 1 percent by four seconds, and the sample of B2C stores was small and the pattern is a correlation, not proof of cause. Even so, any delay a testing tool adds on your checkout, category, and product pages is a cost worth measuring.
Anti-flicker is not free
Most testing tools offer an anti-flicker snippet that hides the page, or part of it, until the variant is ready. It removes the visible jolt but trades it for a delay: the browser cannot paint hidden content, so Largest Contentful Paint (LCP) is pushed later, and if the snippet waits on a slow script or a long timeout, shoppers can be left staring at a blank page. Late DOM changes also show up as layout shifts in Cumulative Layout Shift (CLS). The real question is not flicker or no flicker, but which cost your shoppers pay and how much of it.
If you use anti-flicker, scope it: hide only the element under test rather than the whole page, set a short timeout, and do not load it on pages where no experiment is running.
Why your A/B test results can’t show the tool’s own cost
Here is the critical blind spot: A/B testing tools report the performance of the test (variant A vs variant B conversion rates) but not the performance of the tool itself on the overall shopping experience.
When you run a test that lifts conversion by 3 percent on the variant versus the control, you celebrate. But the tool’s overhead, the extra script weight and any page-hiding delay, is paid by every visitor in every arm. If the tool added 200ms of load time, the true baseline, what your conversion rate would be without the testing tool running, might be higher than either group. You just cannot see it because both groups carry the same overhead.
Flicker is a separate problem. It only appears when a variant is applied to a page that has already started to render, so it mostly affects the variant group, not the control. That can bias a result against the variant: a variant that would win on a clean load may look flat because some visitors saw a jolt before they saw the change.
Effect sizes in eCommerce experiments are also usually small. Large meta-analyses of eCommerce A/B tests have found that the typical experiment moves revenue by only around a percent or less. That makes the measurement problem acute: if a winning variant’s genuine lift is 1–2 percent but the testing tool’s overhead costs a comparable amount in performance, the tool can erase the very gain it detects.
This means:
- Your control group is not a true control. It is a “control plus the performance cost of the testing tool.”
- Your variant lift is measured against a degraded baseline. The test may show a winner, but both groups underperform what an untested, clean-loading page would deliver.
- You cannot calculate ROI without measuring the tool’s own cost. The performance tax applies to every visitor on every page, while the conversion lift applies only to visitors in the winning variant on pages with active tests.
Signs your A/B testing tool is hurting performance
How do you know if your A/B testing tool is degrading performance?
- Visible flicker: The page content visibly shifts, flashes, or rearranges shortly after initial render. This is most noticeable on slower mobile connections and mid-range devices.
- Increased Largest Contentful Paint (LCP): The render-blocking snippet, or the anti-flicker that hides the page, delays the largest visible element. Compare LCP in your field data (CrUX or RUM) against lab tests with the snippet removed.
- Higher Interaction to Next Paint (INP): If the testing script competes for main thread time, interactions feel sluggish.
- Cumulative Layout Shift (CLS) spikes: DOM modifications after initial render create layout shifts that degrade visual stability scores.
- Elevated bounce rate on pages with active tests: If bounce rate is higher on pages where the testing tool is actively modifying the DOM, the flicker may be causing visitors to leave.
How to measure what your A/B testing tool really costs
Step 1: Run a performance A/B test on the tool itself
The most direct measurement: run a randomised traffic split where 50 percent of visitors receive the page without the A/B testing snippet loaded at all. Compare Core Web Vitals and conversion rate for the two groups. The difference is the tool’s cost.
Step 2: Compare lab and field data with and without the snippet
Run Lighthouse or WebPageTest with and without the testing snippet. Measure the difference in LCP, Total Blocking Time (TBT), and Speed Index. Then compare against your field data from CrUX or a real-user monitoring tool to see if the lab delta matches the real-world impact.
Step 3: Audit script loading and execution time
Use browser DevTools Performance panel to measure:
- How long the testing snippet takes to download, parse, and execute
- Whether it loads synchronously (blocking render) or asynchronously (potentially causing flicker)
- Whether it is installed directly in your theme or delivered through a tag manager, which can delay it further
- How many network requests it makes during experiment evaluation
- How much main thread time it consumes during page load
Step 4: Measure flicker duration and frequency
Use a real-user monitoring tool or manual observation across devices, including a throttled mid-range phone, to measure how long the flicker lasts and what percentage of page loads exhibit visible content shifting from the testing tool’s DOM manipulation.
How to reduce or eliminate the performance cost of A/B testing
- Use anti-flicker techniques sparingly and scope them: Hide only the element under test, not the whole page. This eliminates visual flicker but adds perceived load time, a tradeoff you should measure.
- Load the snippet asynchronously with a timeout: Set a maximum evaluation time (e.g., 200ms). If the test cannot evaluate in time, show the original page. This caps the worst-case delay. Asynchronous loading reduces blocking but can increase flicker, while synchronous loading blocks rendering, so measure both on your own pages.
- Limit the snippet to pages with active experiments: Do not load the full testing script, or its page-hiding code, on pages where no test is running. Many tools support conditional loading.
- Be careful with above-the-fold tests: If the element under test is your hero image, main headline, or primary navigation, a client-side change is the most expensive kind. Consider implementing those experiments server-side or at the edge, and limit how many tests run at once.
- Consider server-side or edge-side testing: Server-side A/B testing evaluates variants before the page reaches the browser, eliminating both flicker and client-side script overhead. Edge-side testing, which runs at the CDN, is a middle ground with a similar profile. Some tools also achieve near-flicker-free client-side testing with lightweight scripts, which shows the overhead is implementation-dependent, not inherent to testing.
- Remove dormant experiments: Old experiments that are still evaluated but not active consume processing time. Clean them up regularly.
- Ask your vendor for evidence: Request Core Web Vitals benchmarks with and without the snippet and its anti-flicker setting, then verify them with your own holdout.
Keeping your testing stack net-positive with continuous monitoring
The performance cost of your A/B testing tool is not a one-time measurement. It changes every time you:
- Add a new experiment
- Increase the complexity of targeting rules
- Add audience segments or personalisation layers
- Update the testing tool’s SDK version
- Layer multiple tools (testing + personalisation + analytics) on the same page
A one-off audit goes stale quickly. You need to keep watching what your actual shoppers experience on the pages where tests run, not just the conversion delta between variant A and variant B.
AuditIQ’s Real User Monitoring is built for that:
- Real-world LCP, CLS, and INP tracking: Google CrUX field data alongside Lighthouse scores, so you see what shoppers actually experience and can compare it with your with-and-without-snippet lab tests.
- Cross-device monitoring: separate mobile and desktop metrics, where flicker and main-thread contention are usually worst.
- Degradation alerts: you’re notified when a meaningful worsening trend emerges, so an experiment launch or SDK update that pushes LCP or CLS the wrong way surfaces quickly.
- Historical trend analysis: 30-day graphs to line up changes in your metrics against the day you launched or changed a test.
- Page-level breakdown: track up to 10 pages, including product, category, and checkout, where a testing script costs the most.
- Script Inventory, a continuously updated ledger of every script running on your store, so you can confirm the testing snippet loads only where intended and is truly gone after you remove it.
Real User Monitoring shows when and where performance moves. Confirming that the testing tool is the cause still takes a with-and-without comparison, as described above.
Beyond performance, AuditIQ is a 360° eCommerce monitoring platform purpose-built for Magento, Adobe Commerce, and Shopify stores. It continuously monitors every critical layer of a store — performance, infrastructure, SEO, security, user experience, configuration, and code quality — from a single, unified dashboard, so you can find and fix what is costing you conversions before it accumulates into measurable revenue loss.
Start monitoring your real-user performance for free today to see whether your testing stack is net-positive for your shoppers.
The goal is not to stop testing. It is to ensure your testing infrastructure is net-positive: delivering more conversion lift than it costs in performance degradation. Without measuring both sides of that equation, you are optimising in the dark.
Others also read
- Why your eCommerce site passes Lighthouse but real shoppers still experience a slow store
- Shopify store slow after installing apps? Full guide to find the scripts that are silently killing your conversions
- Third-party JavaScript on checkout: Security, performance & compliance risks
Frequently asked questions
1. Does every A/B testing tool cause flicker?
Most client-side tools can cause flicker if not configured with an anti-flicker snippet or if the snippet loads asynchronously without a page-hide mechanism. Server-side testing tools eliminate flicker entirely because the variant is resolved before the page reaches the browser.
2. Does an anti-flicker snippet hurt Core Web Vitals?
It can. Hiding the page until the variant is ready delays the largest visible element, which pushes LCP later, and a long timeout can leave shoppers on a blank page. Scoping the hiding to the element under test, keeping the timeout short, and skipping pages with no active experiment all reduce the cost.
3. How much conversion am I losing to my A/B testing tool’s overhead?
This depends on your implementation, but a testing tool that delays the largest visible element on every page load could reduce conversion measurably across all visitors, not just those in active tests. The only way to quantify it for your store is to measure with and without the snippet.
4. Should I stop A/B testing if the tool is slowing down my site?
No. The answer is to optimise or replace the testing implementation, not to stop testing. Server-side testing, conditional loading, scoped anti-flicker techniques, and dormant experiment cleanup can reduce the overhead substantially while preserving the ability to test.
5. Can I detect the flicker effect in my analytics?
Not directly. The flicker creates a negative visual experience that contributes to bounce and abandonment, but it does not fire a specific analytics event. You need real-user monitoring or visual session recording to see it.
About the author
Ginny Ngo writes from AuditIQ's experience monitoring eCommerce performance, SEO, security, and reliability issues across Magento, Shopify, WooCommerce, and Adobe Commerce stores.